


Assessment
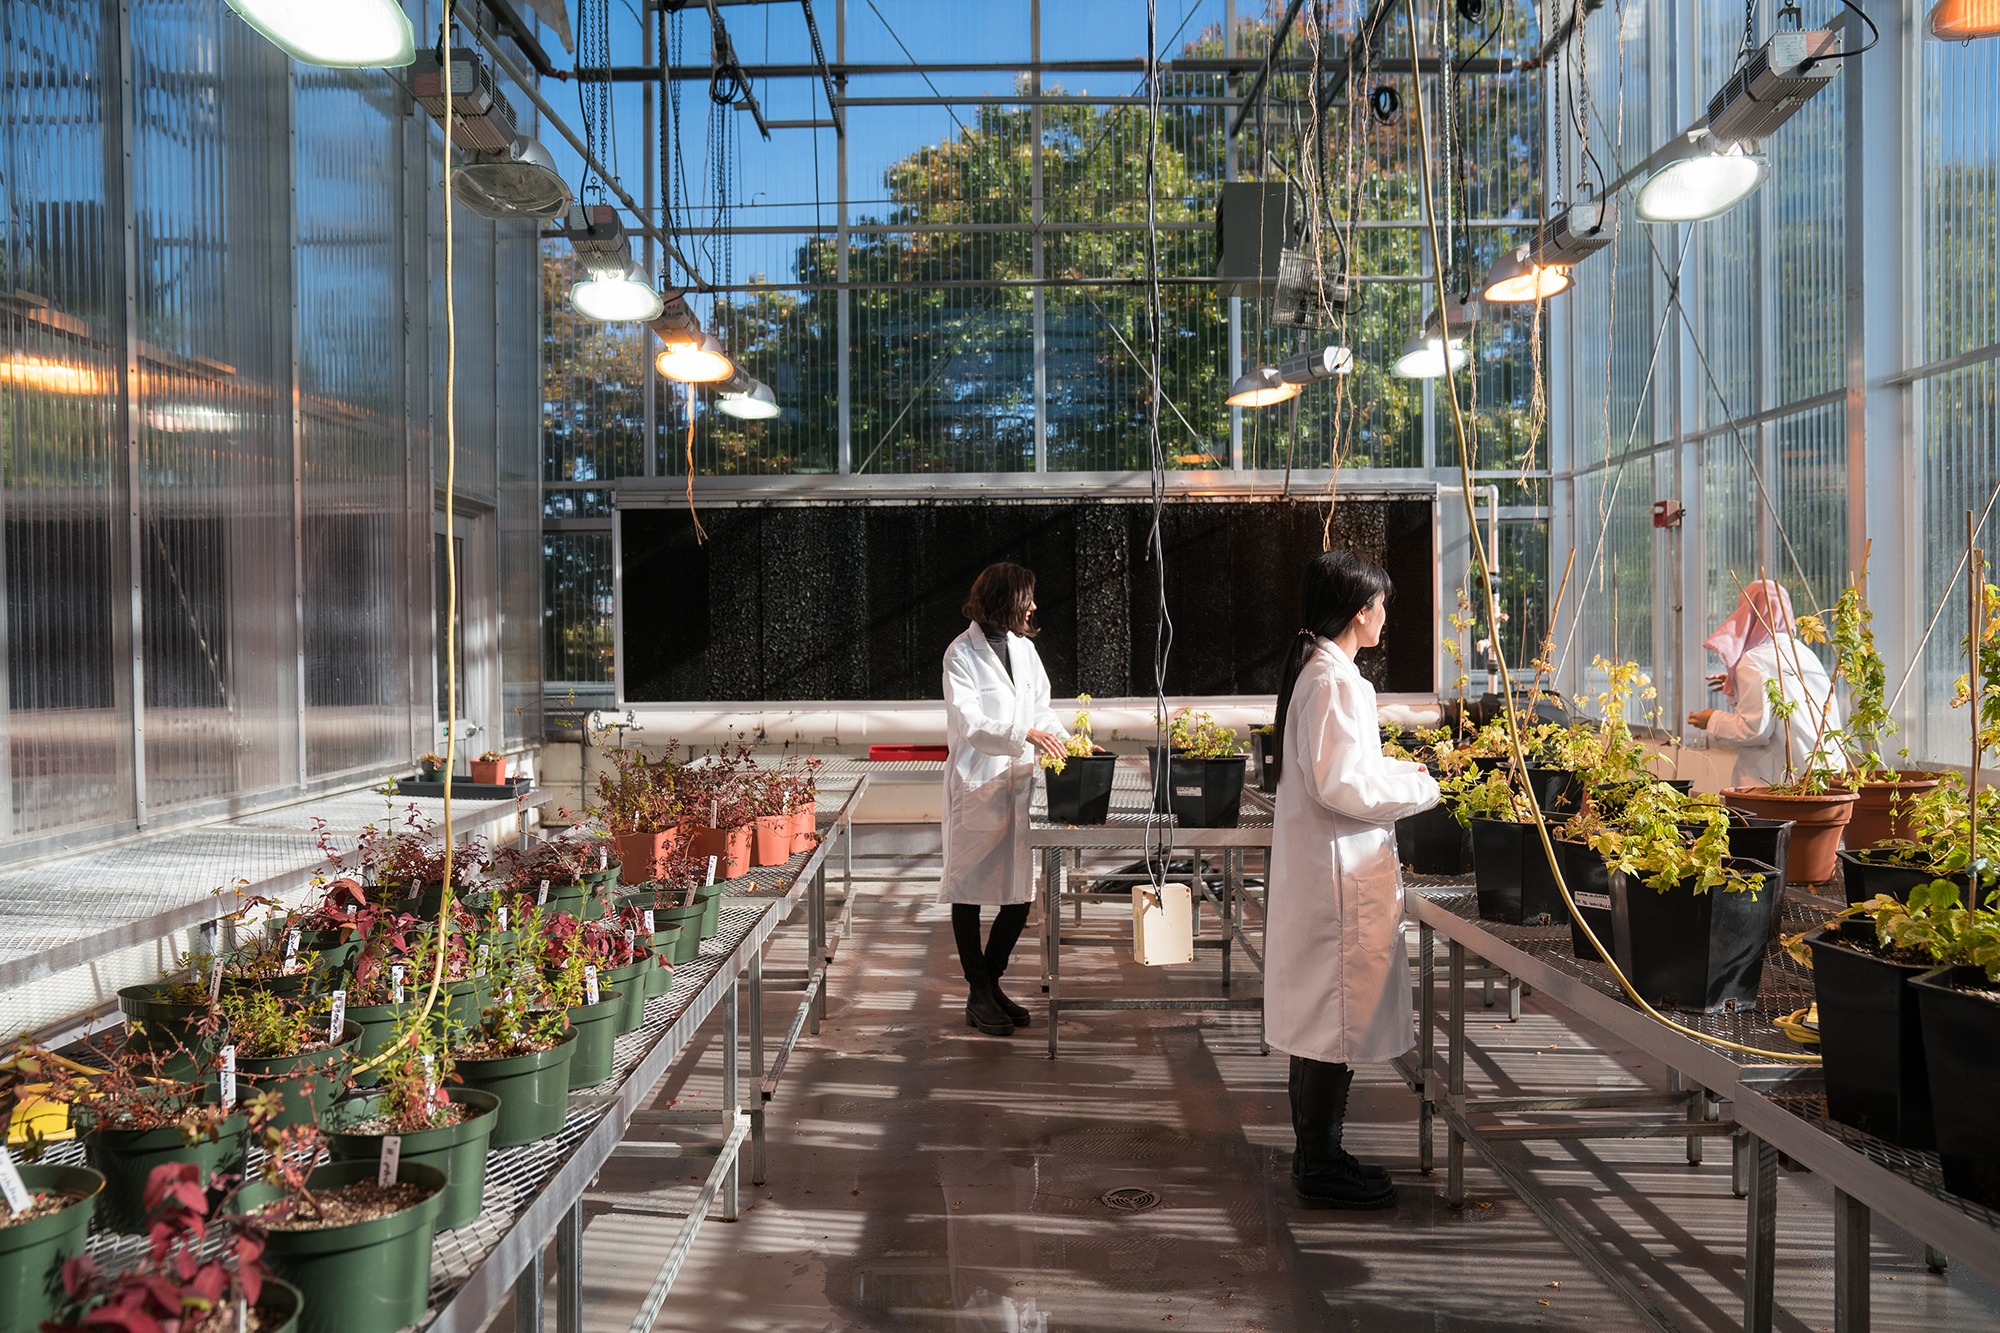
Bar graph titled 'SLO EXS 427 A.1 STUDENT SELF-EFFICACY OF INFORMATION LITERACY'. The graph has three vertical bars representing 'Pre-test', 'Post-test', and 'Benchmark'. The 'Pre-test' bar shows 70.70%, the 'Post-test' bar shows a significant increase at 90.70%, and the 'Benchmark' bar is much lower at 20%. Each bar is a different shade of blue on a dark background, with percentage values labeled on top of each bar. The y-axis is labeled with percentages ranging from 0.00% to 100.00%, in increments of 10.00%.
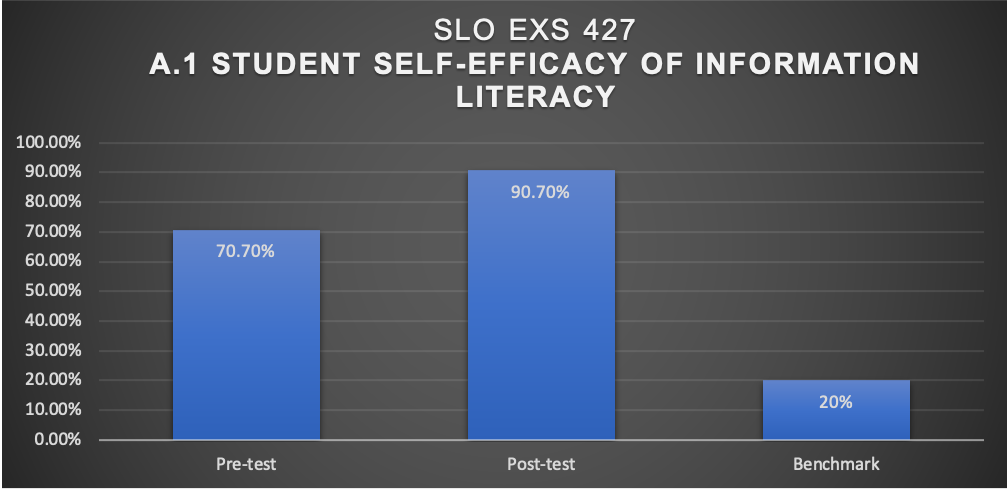
3D bar graph titled 'SLO EXS 427 A.2 ABILITY TO ANALYZE AND DESCRIBE CURRENT TRENDS IN THE FIELD'. The graph displays three dimensional bars for 'Pre-test', 'Post-test', and 'Benchmark'. The 'Pre-test' bar is at 51.25%, depicted on the left side, the 'Post-test' bar in the center is higher at 66.25%, and the 'Benchmark' bar on the right is at 15%. Each bar is blue and has its corresponding percentage value labeled on its top surface. The background is dark, and the perspective gives a three-dimensional look to the bars.
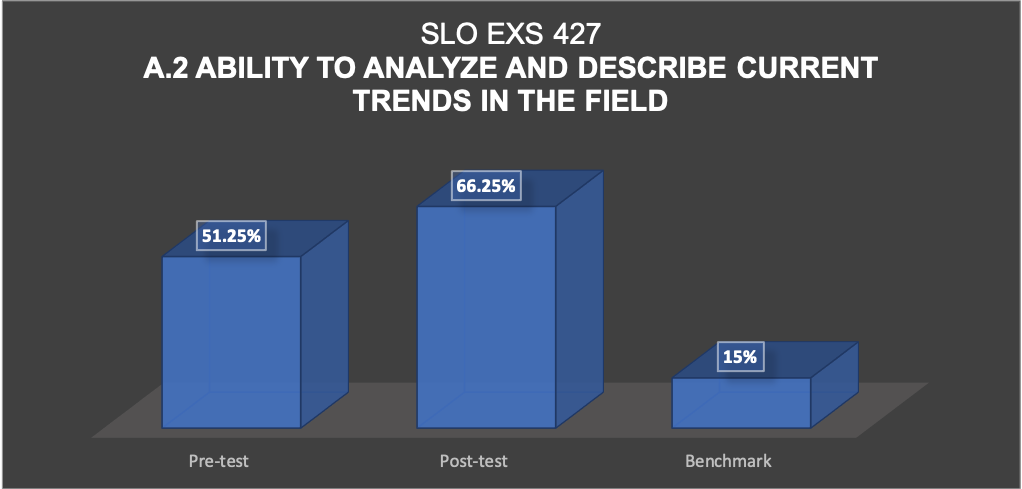
3D bar graph titled 'SLO EXS427 A.3 ABILITY TO ANALYZE AND EVALUATE RESEARCH USING MID-TERM EXAM'. The graph features two three-dimensional bars labeled 'Mid-term exam' and 'Benchmark'. The 'Mid-term exam' bar is colored blue, significantly taller, and indicates a 100% level. The 'Benchmark' bar is gray and stands at 75%. Both percentages are displayed on the top of the respective bars. The graph has a dark background, and there's a light source creating subtle shadows to the right of the bars, enhancing the 3D effect.
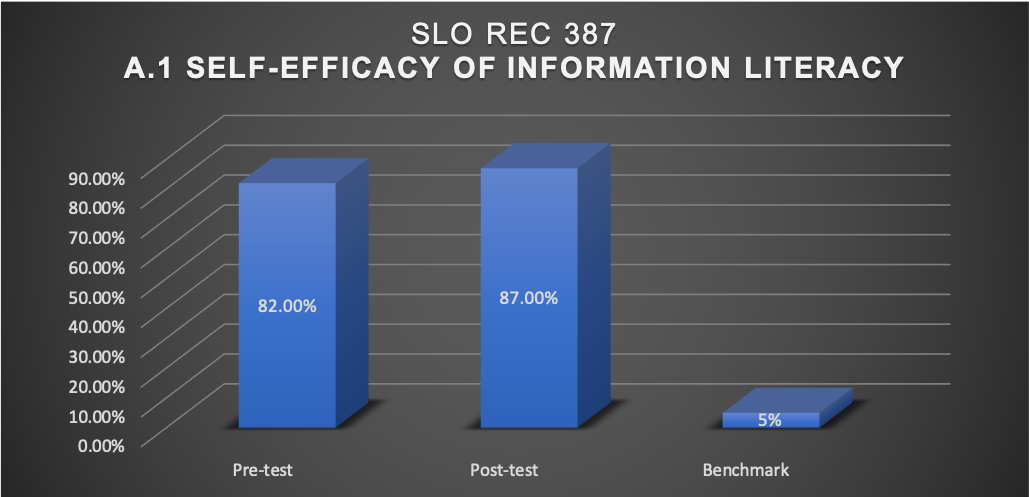
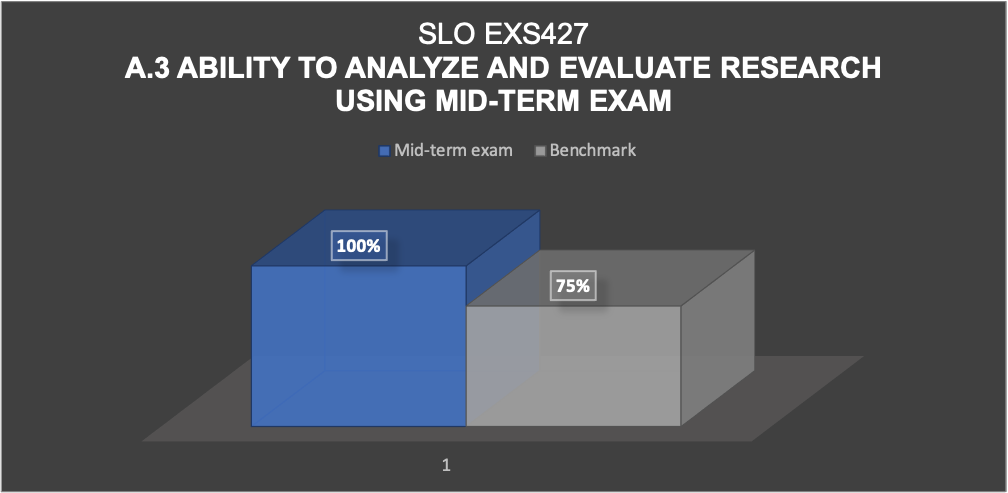
3D bar graph titled 'SLO REC 387 A.1 SELF-EFFICACY OF INFORMATION LITERACY'. The graph shows three vertical bars representing 'Pre-test', 'Post-test', and 'Benchmark'. The 'Pre-test' bar shows an 82.00% level, the 'Post-test' bar shows an increased level of 87.00%, and the 'Benchmark' bar is much lower at 5%. Each bar is blue and the percentages are labeled at the top of the first two bars. The background is dark with a grid, and the y-axis is labeled with percentages from 0.00% to 90.00% in increments of 10.00%.
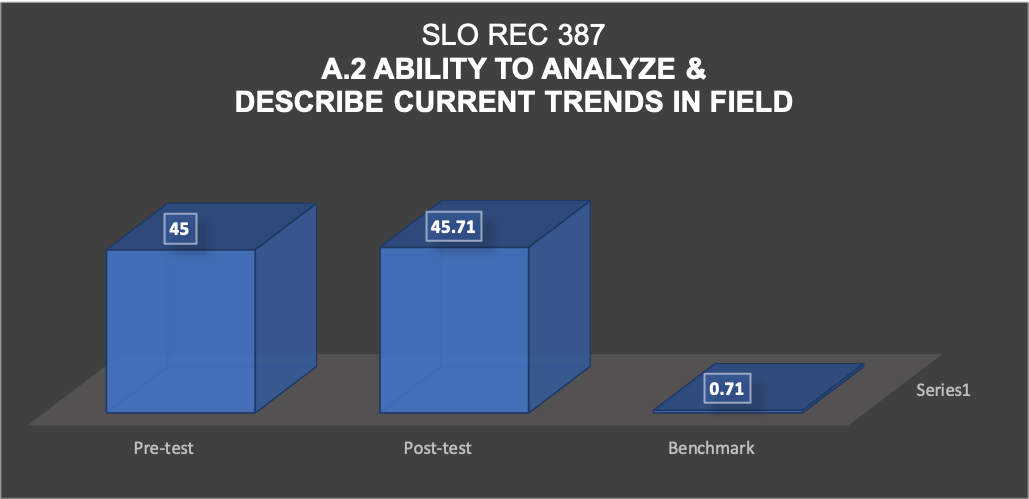
3D bar graph titled 'SLO REC 387 A.2 ABILITY TO ANALYZE & DESCRIBE CURRENT TRENDS IN FIELD'. The graph presents three dimensional bars for 'Pre-test', 'Post-test', and 'Benchmark'. The 'Pre-test' bar shows a score of 45, the 'Post-test' bar slightly higher at 45.71, and the 'Benchmark' bar significantly lower at 0.71. The bars are depicted in shades of blue, with the scores labeled on top of the 'Pre-test' and 'Post-test' bars, and on the front face of the 'Benchmark' bar. There is a label 'Series1' next to the 'Benchmark' bar. The background is dark grey, and the bars are placed on a lighter grey floor, giving a floating effect to the graph.
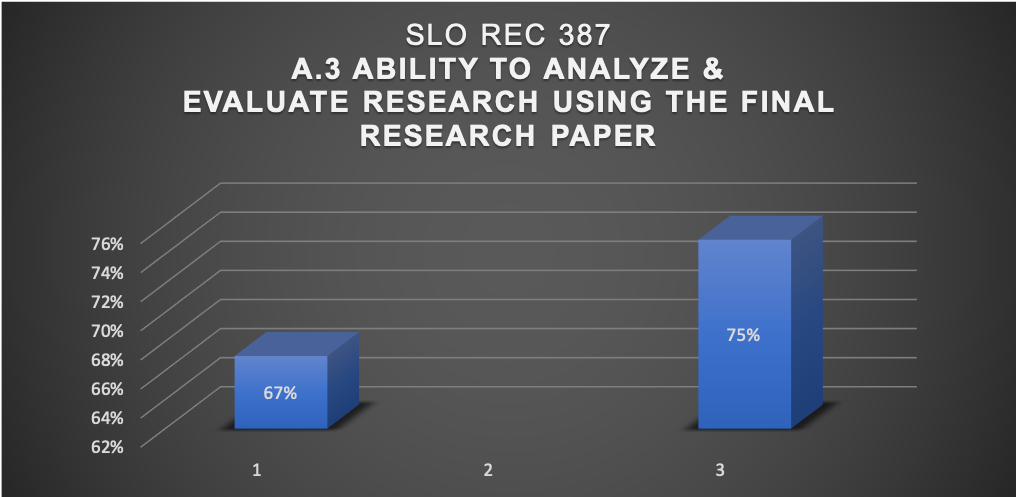
3D bar graph titled 'SLO REC 387 A.3 ABILITY TO ANALYZE & EVALUATE RESEARCH USING THE FINAL RESEARCH PAPER'. The graph has two three-dimensional bars against a numbered background corresponding to different assessments. The first bar, labeled '1', represents an assessment with a score of 67%. The second bar, labeled '3', indicates a higher score of 75%. Both bars are blue and have their percentage scores displayed on top. The background is dark with a grid, and the y-axis on the left side of the graph is labeled with percentages ranging from 62% to 76% in increments of 2%.