


Assessment
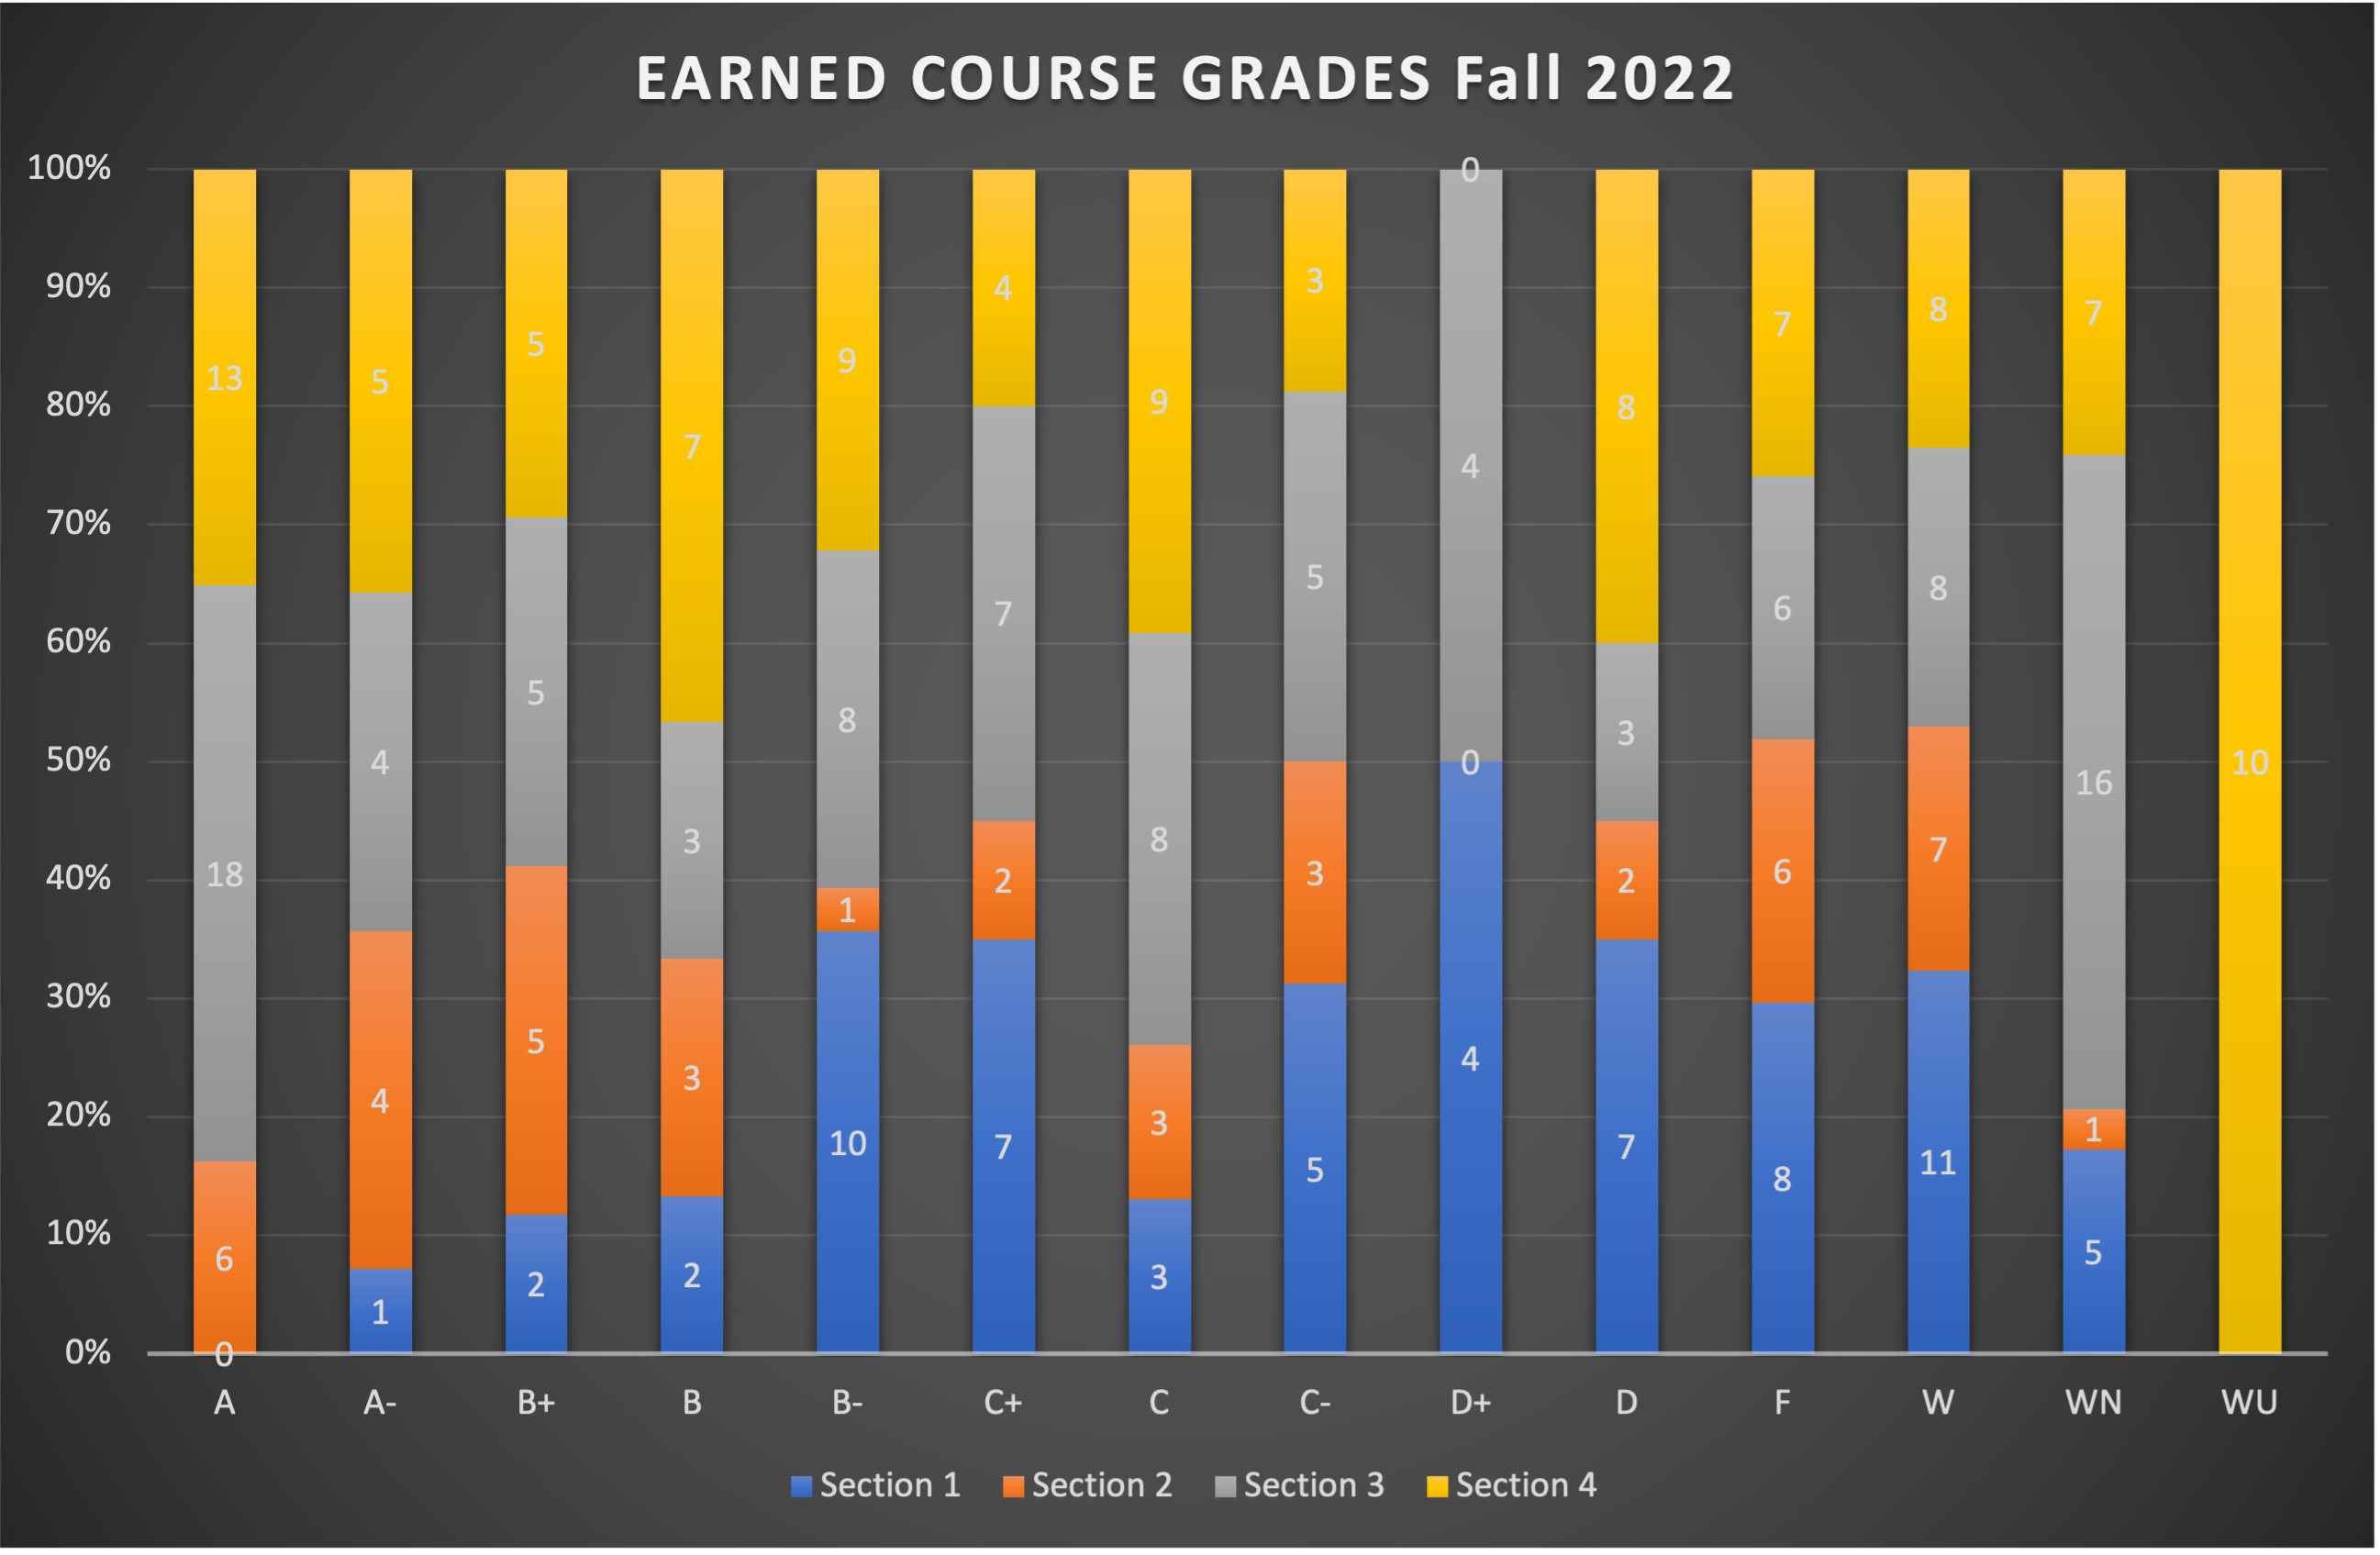
Stacked bar graph showing the spread of grades in 4 sections of HPI 101 courses taught in Fall 2022 (298 students total). Roughly 53% of students passed the course with a C- grade or higher, 23% with a failing grade, and 24% withdrew.
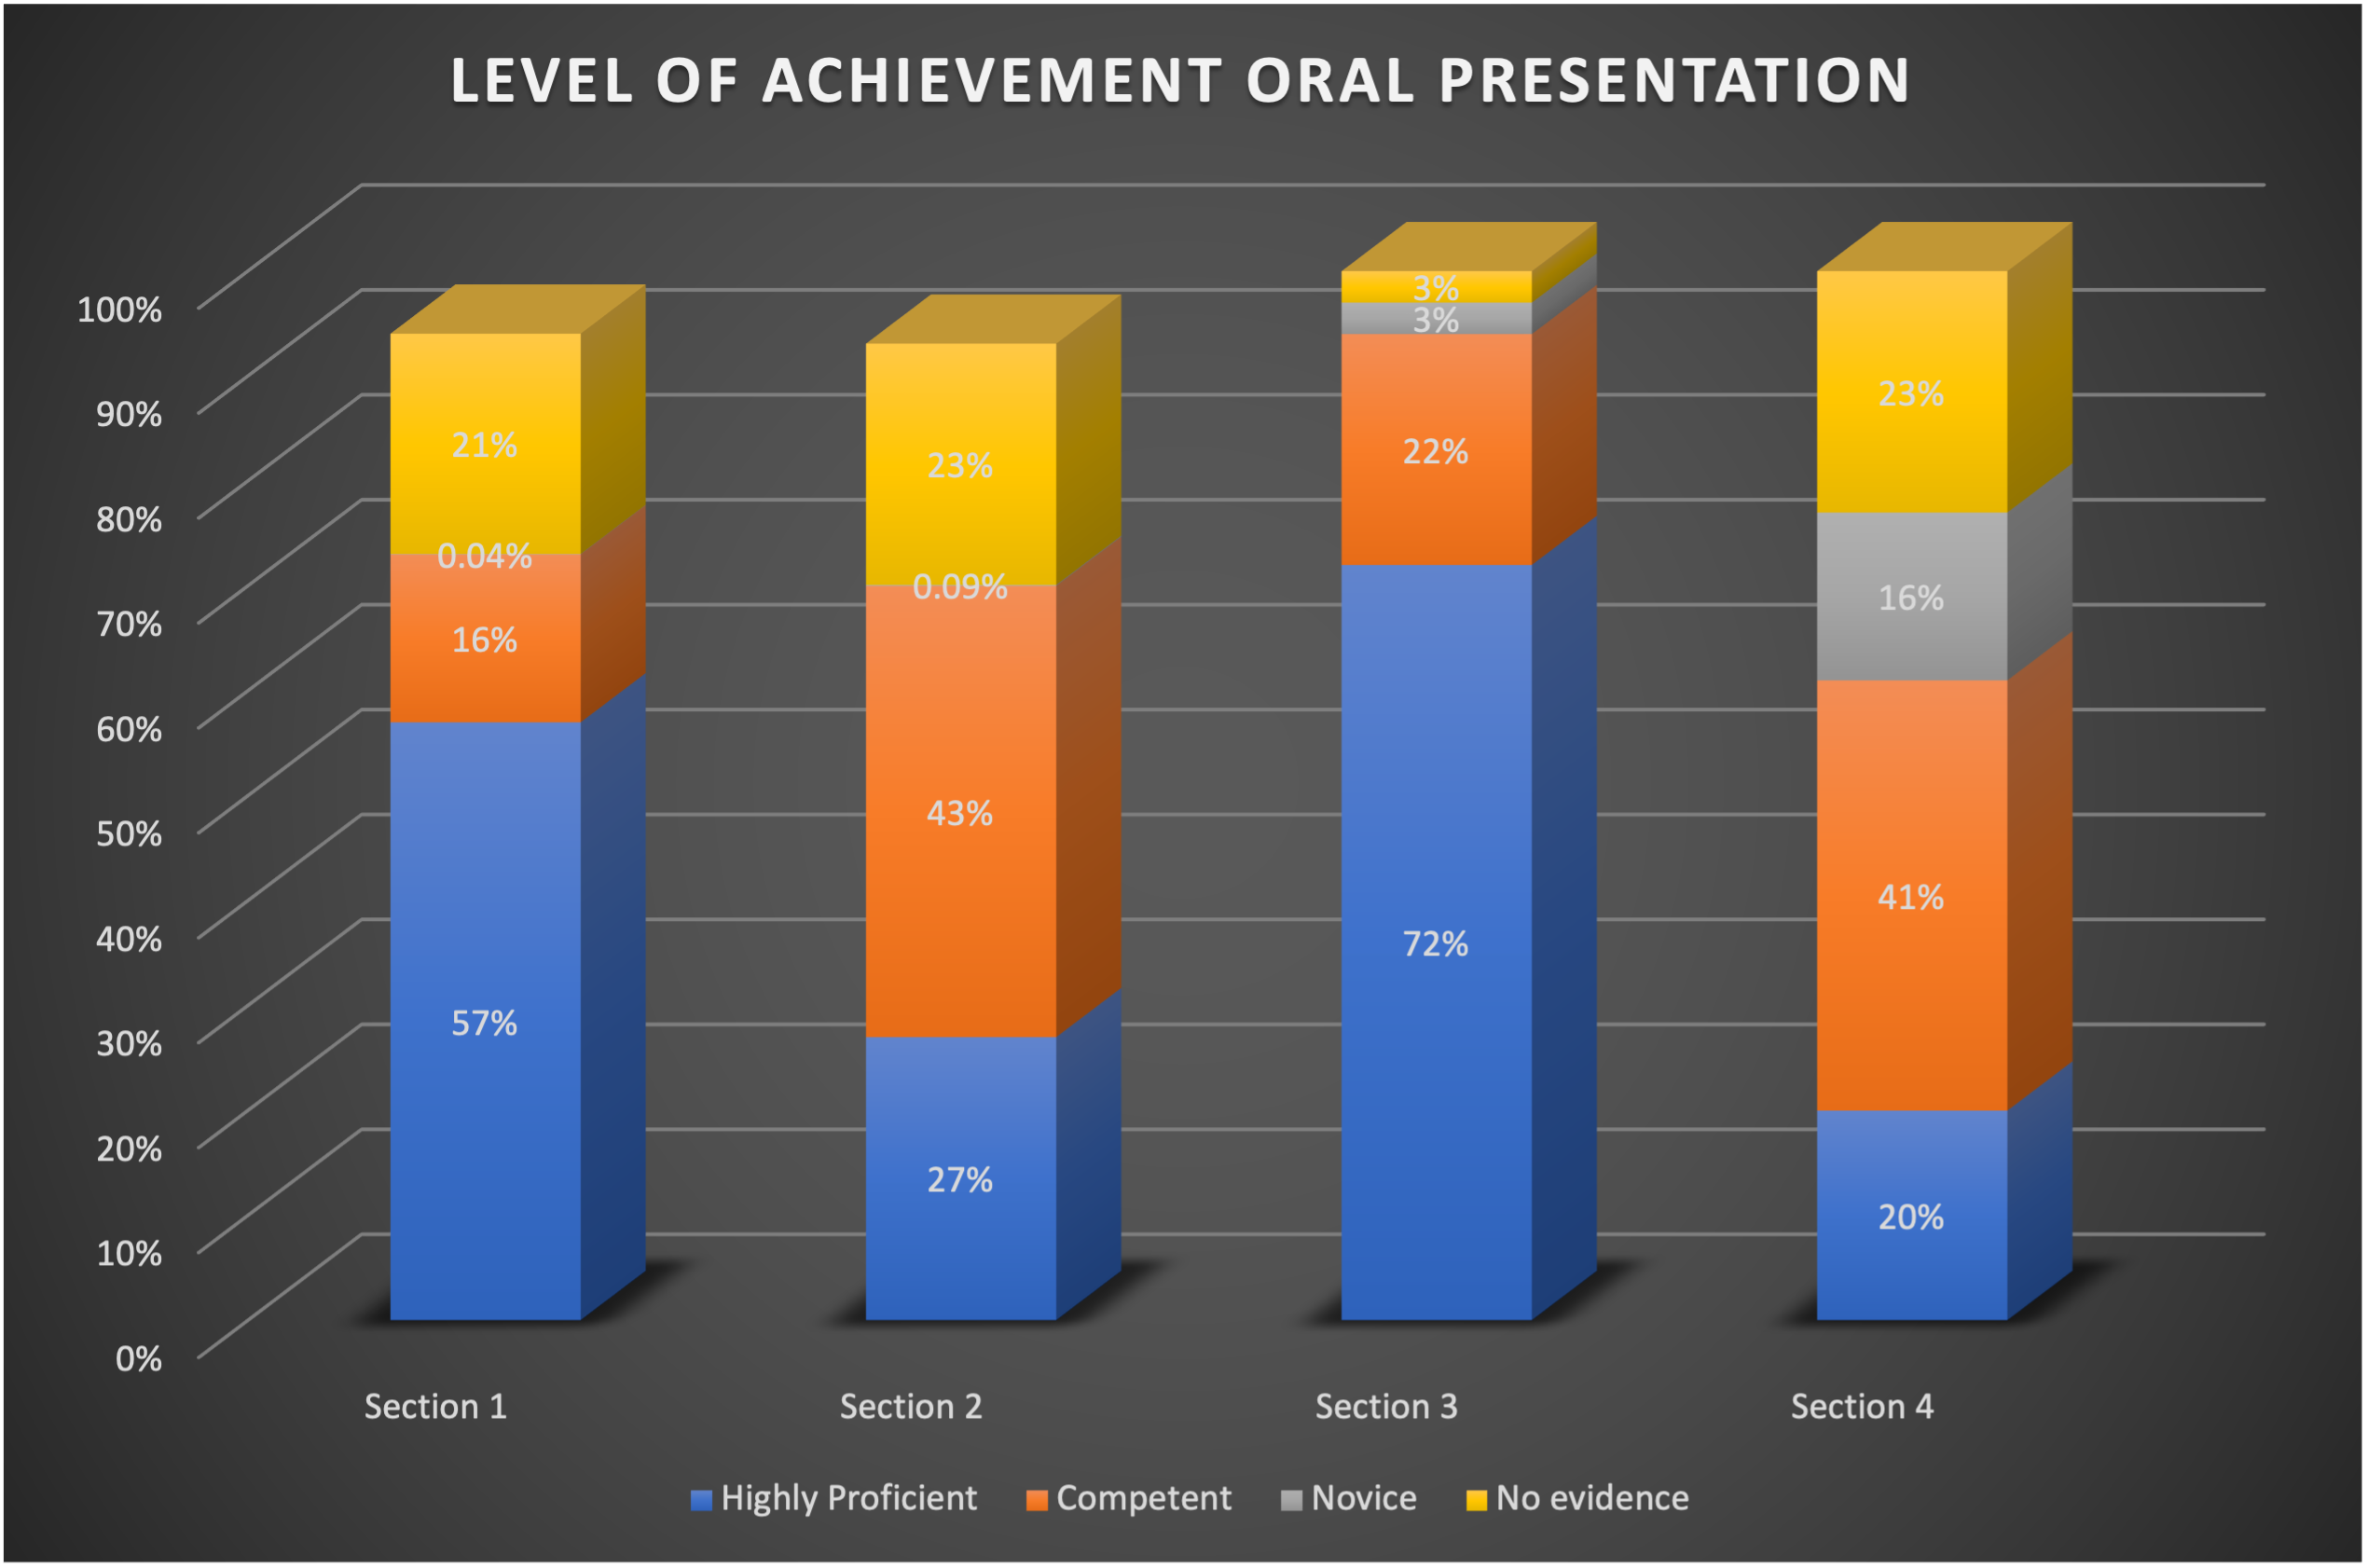
Stacked bar graph showing the proficiency of students' oral presentations across 4 sections of HPI 101. Over 60% of students performance at a level of "competent" or higher. Average of 15% of students did not demonstrate proficiency.
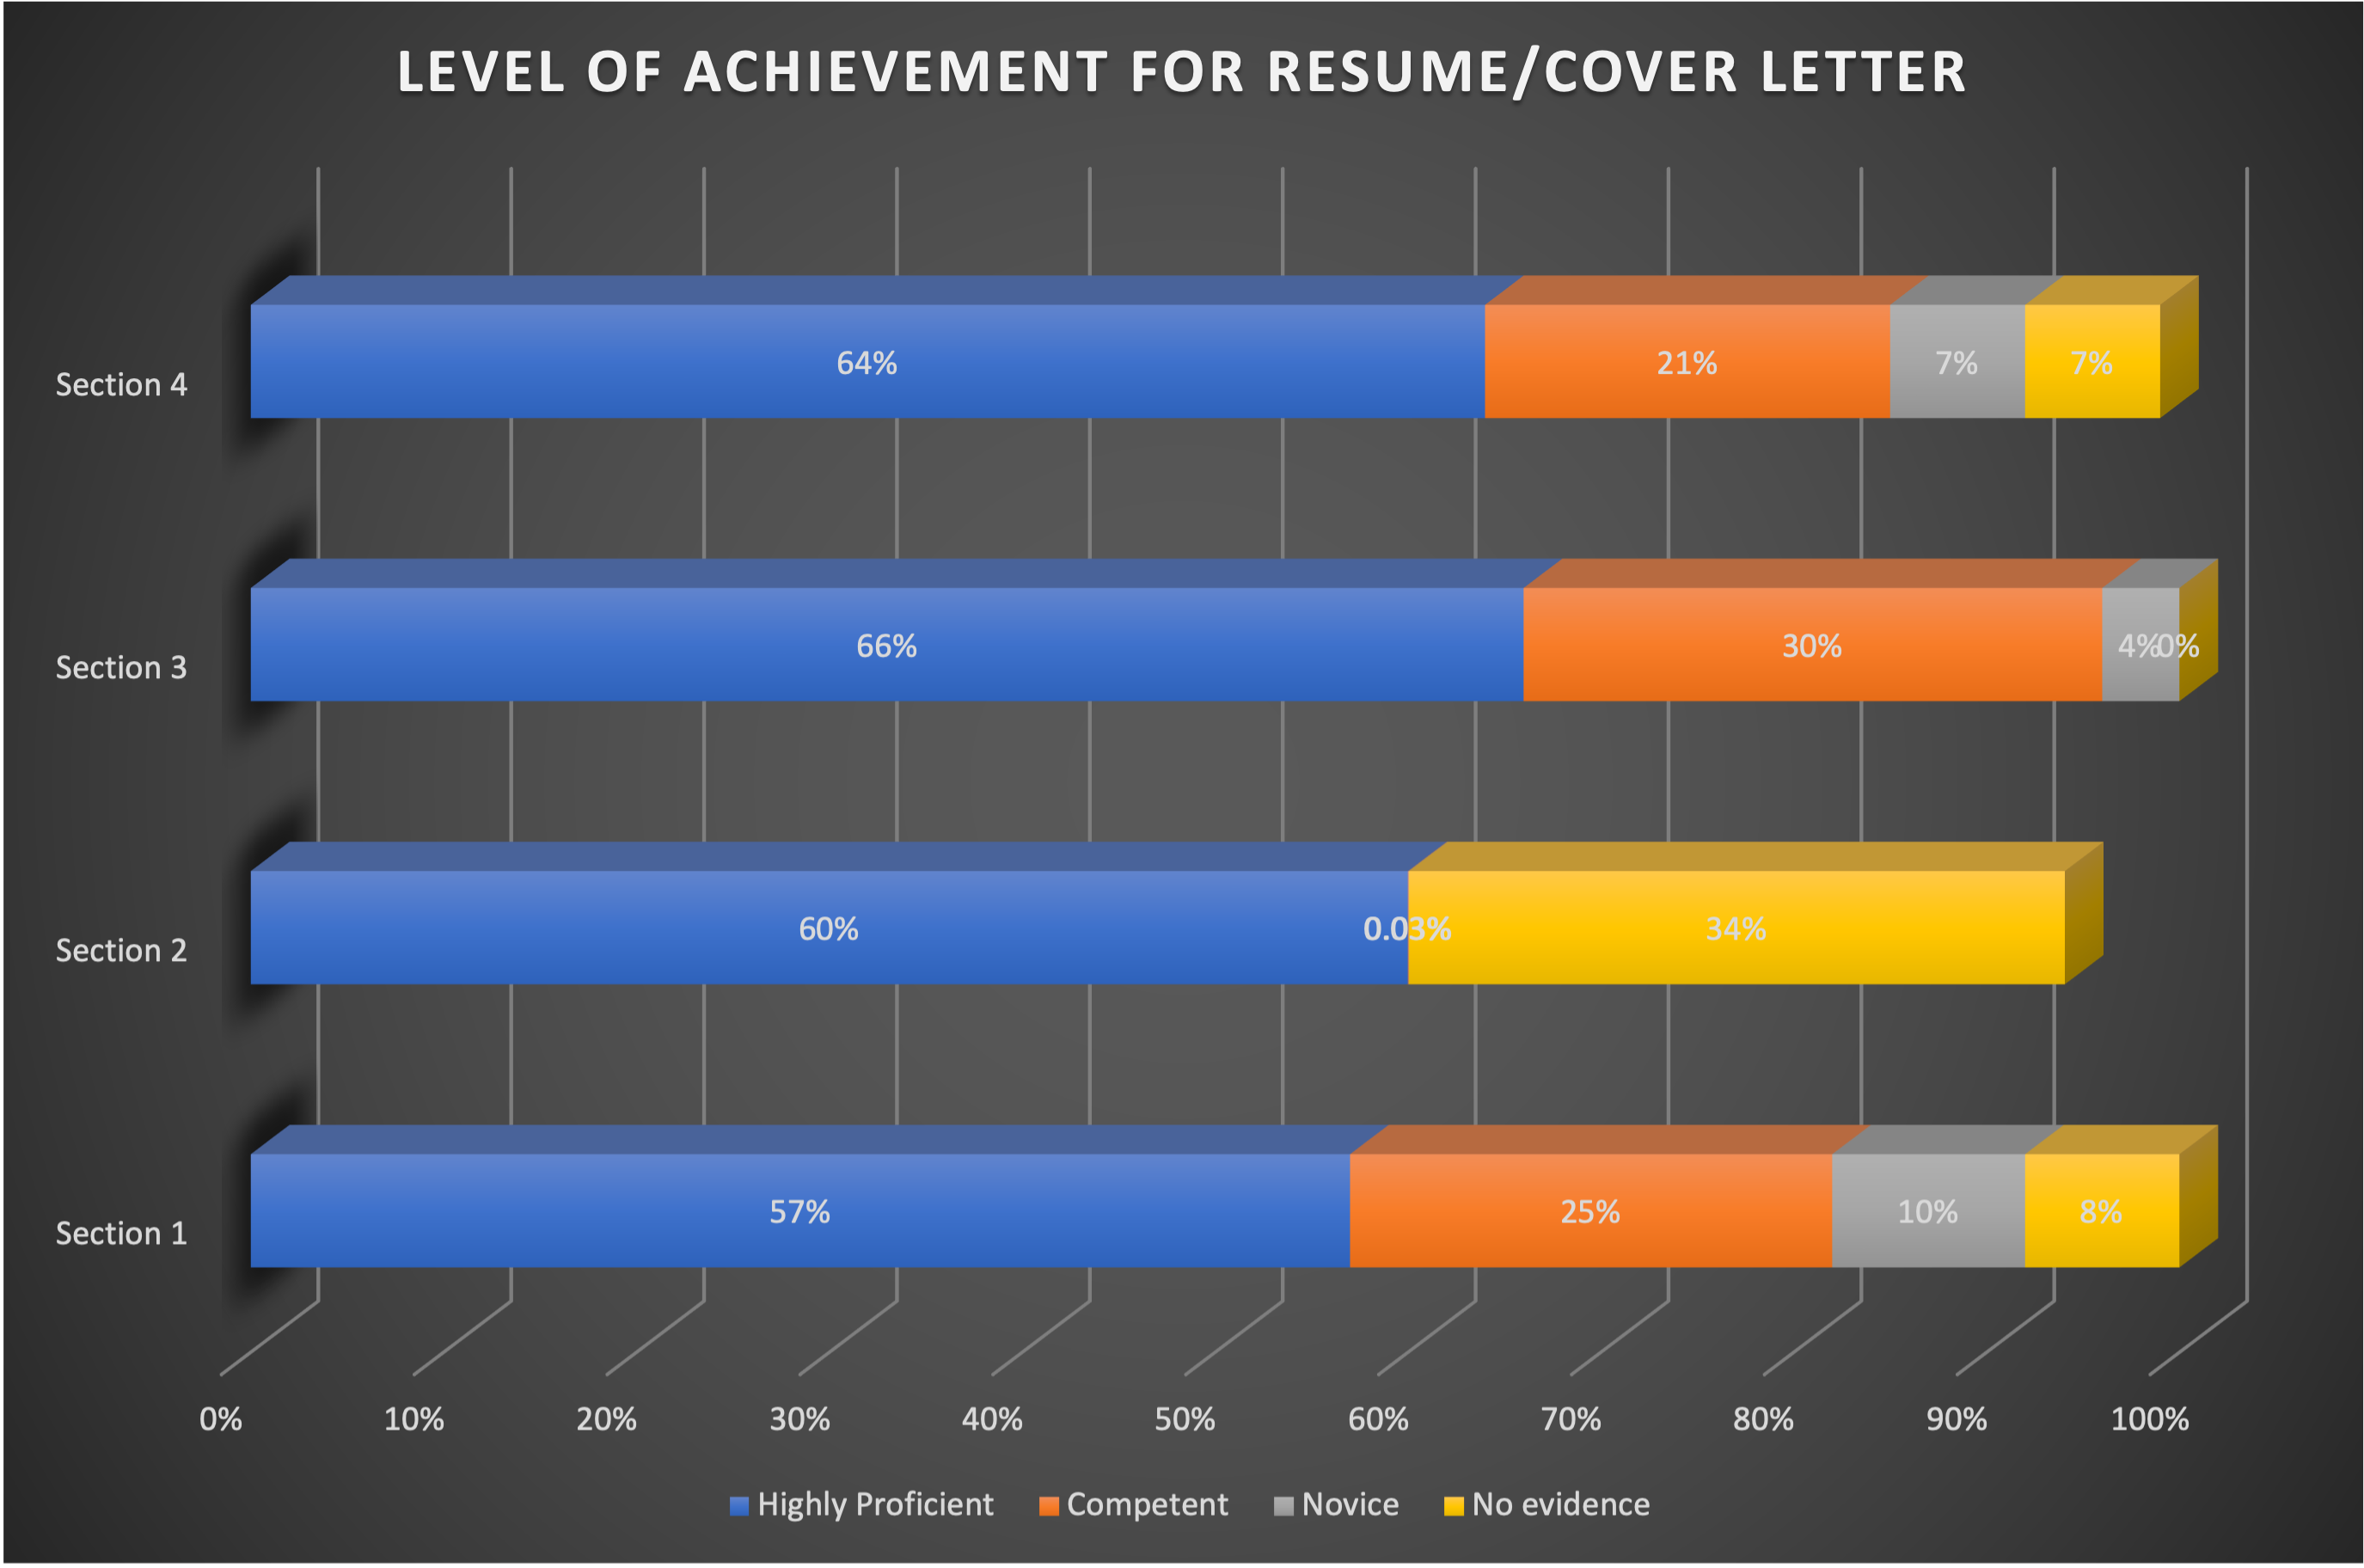
Bar graph showing the proficiency of students' resumes and cover letters across 4 sections of 101. An average of 80% of students performed at a level of "competent" or higher. Average of 5% of students did not demonstrate proficiency.
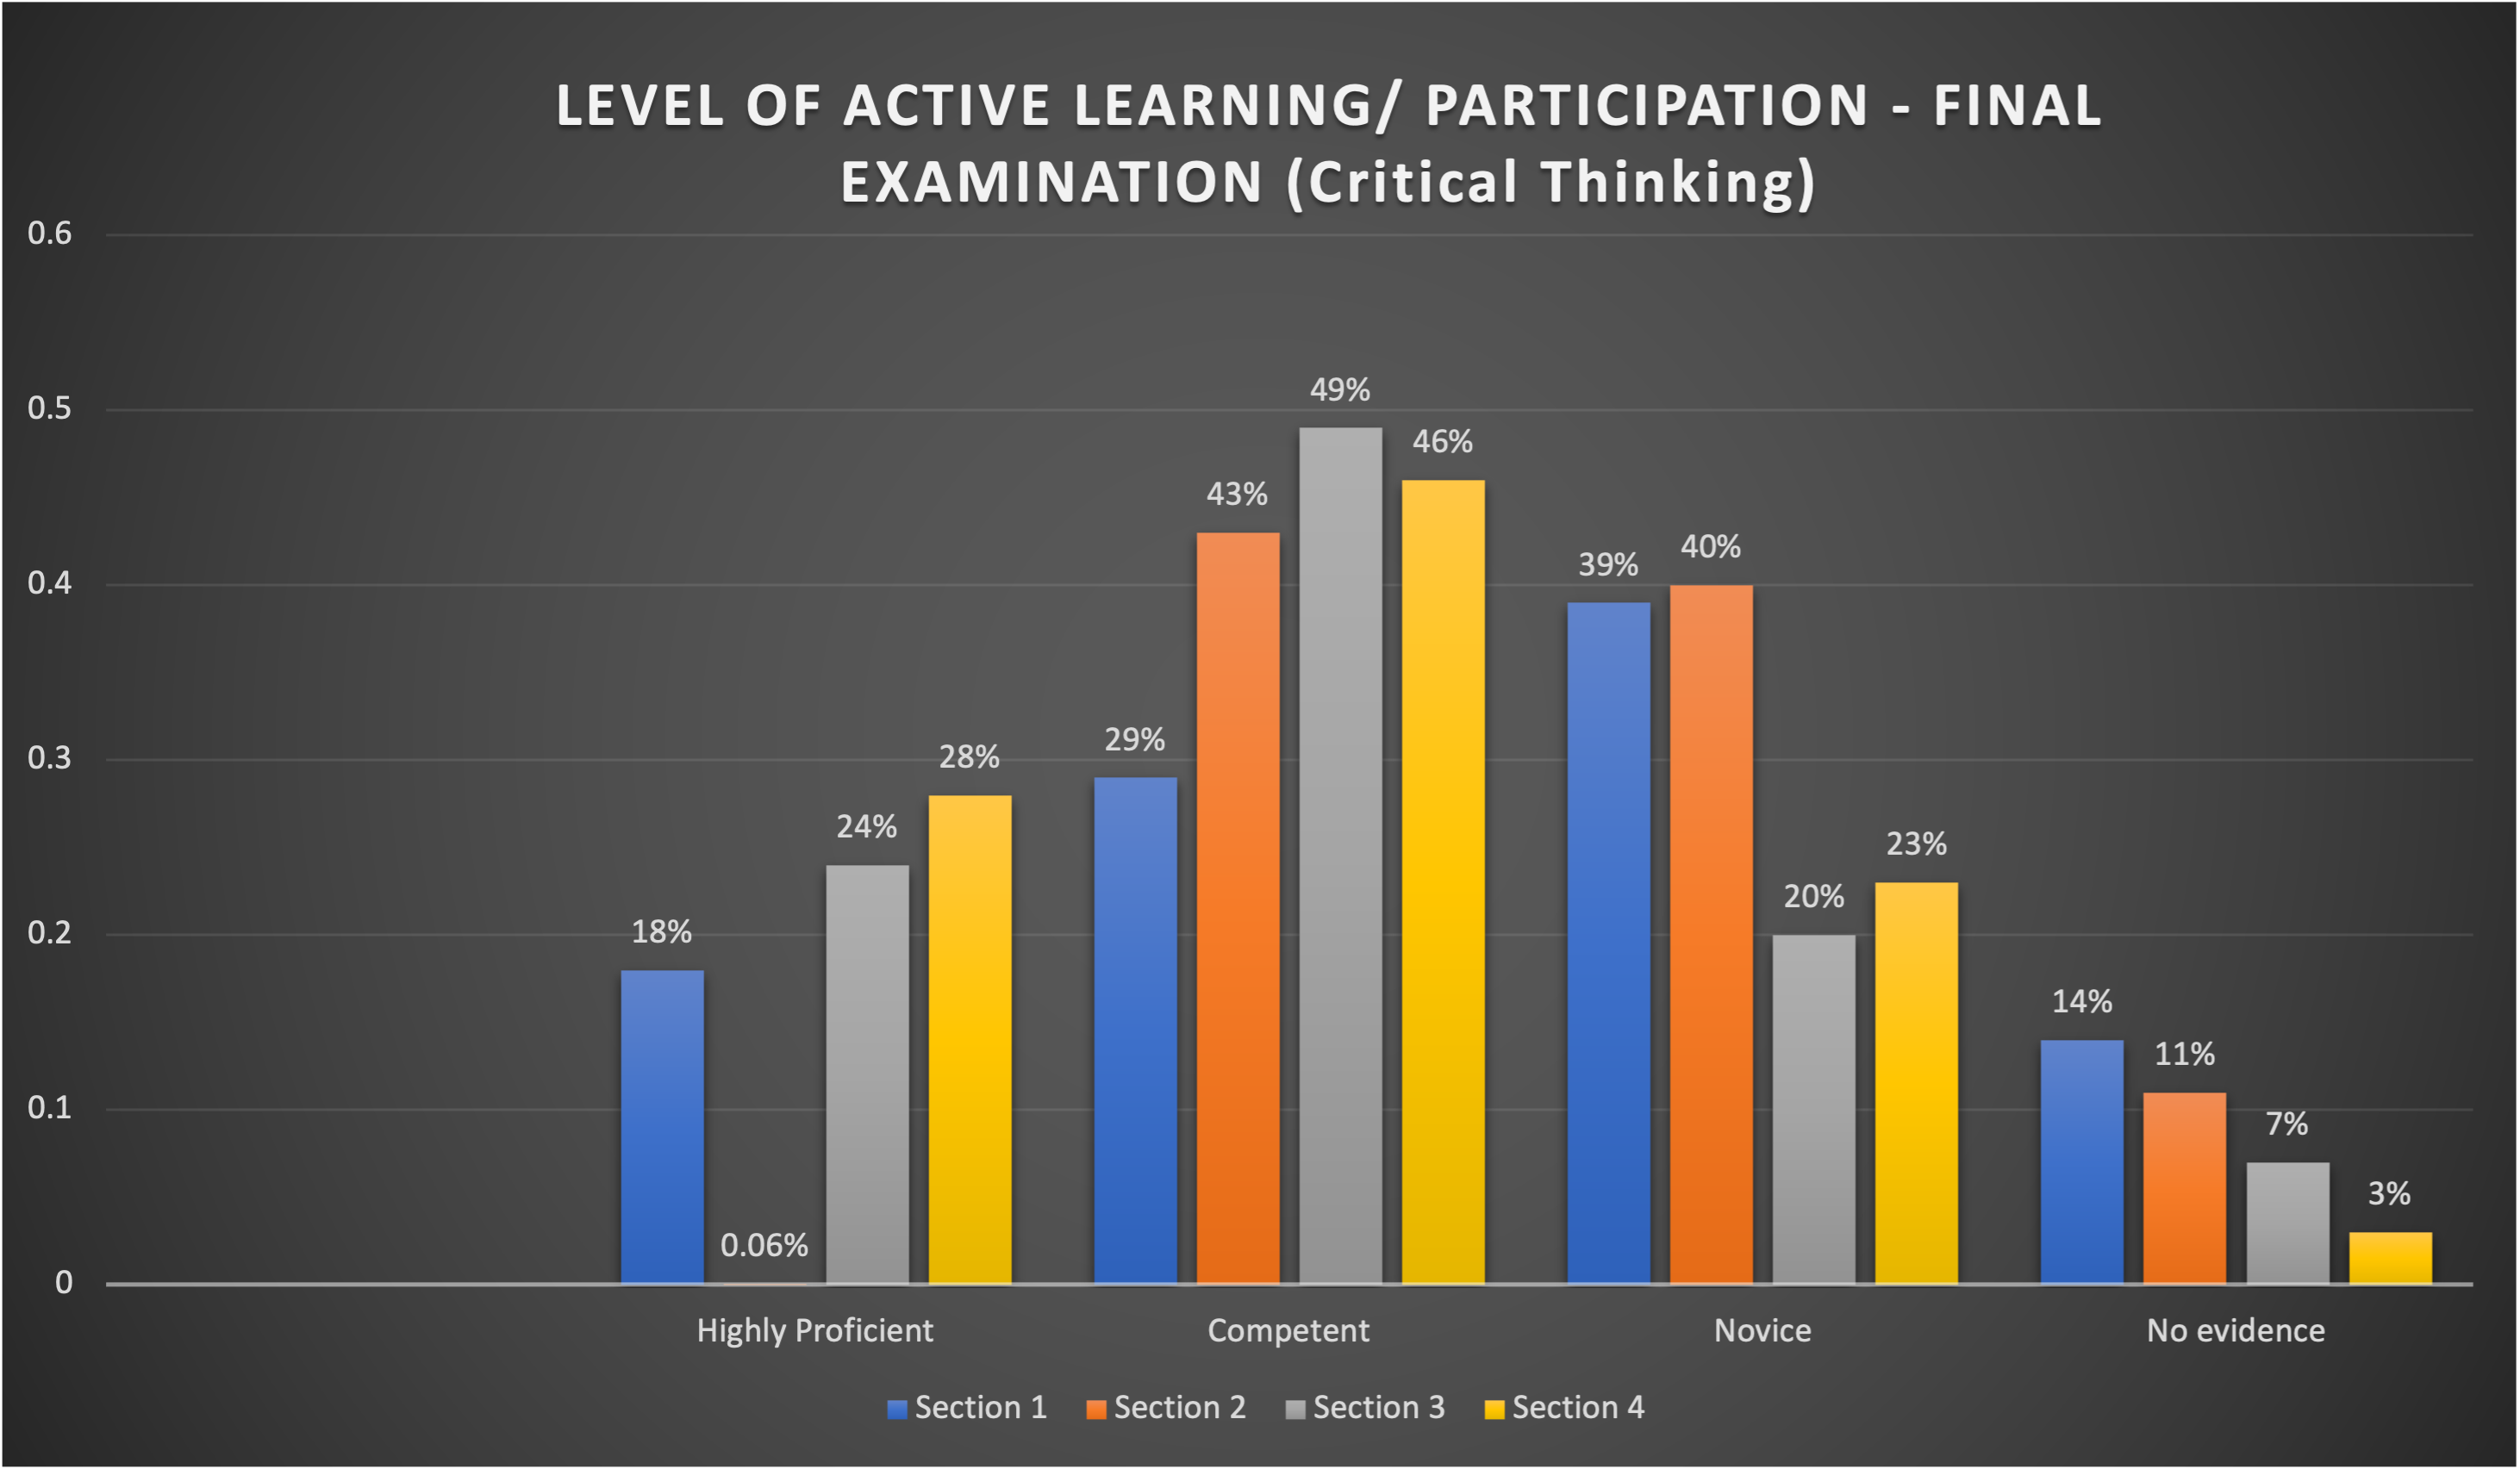
Bar graph titled 'LEVEL OF ACTIVE LEARNING/PARTICIPATION - FINAL EXAMINATION (Critical Thinking)'. The graph is divided into four sections labeled 'Highly Proficient', 'Competent', 'Novice', and 'No evidence', each with four bars corresponding to 'Section 1', 'Section 2', 'Section 3', and 'Section 4'. 'Highly Proficient' shows Section 1 at 18%, Section 2 at 0%, Section 3 at 24%, and Section 4 at 28%. 'Competent' shows Section 1 at 29%, Section 2 at 43%, Section 3 at 49%, and Section 4 at 46%. 'Novice' shows Section 1 at 39%, Section 2 at 40%, Section 3 at 20%, and Section 4 at 23%. 'No evidence' shows Section 1 at 14%, Section 2 at 11%, Section 3 at 7%, and Section 4 at 3%. The background is dark, and the bars are colored in blue, orange, gray, any yellow respectively.
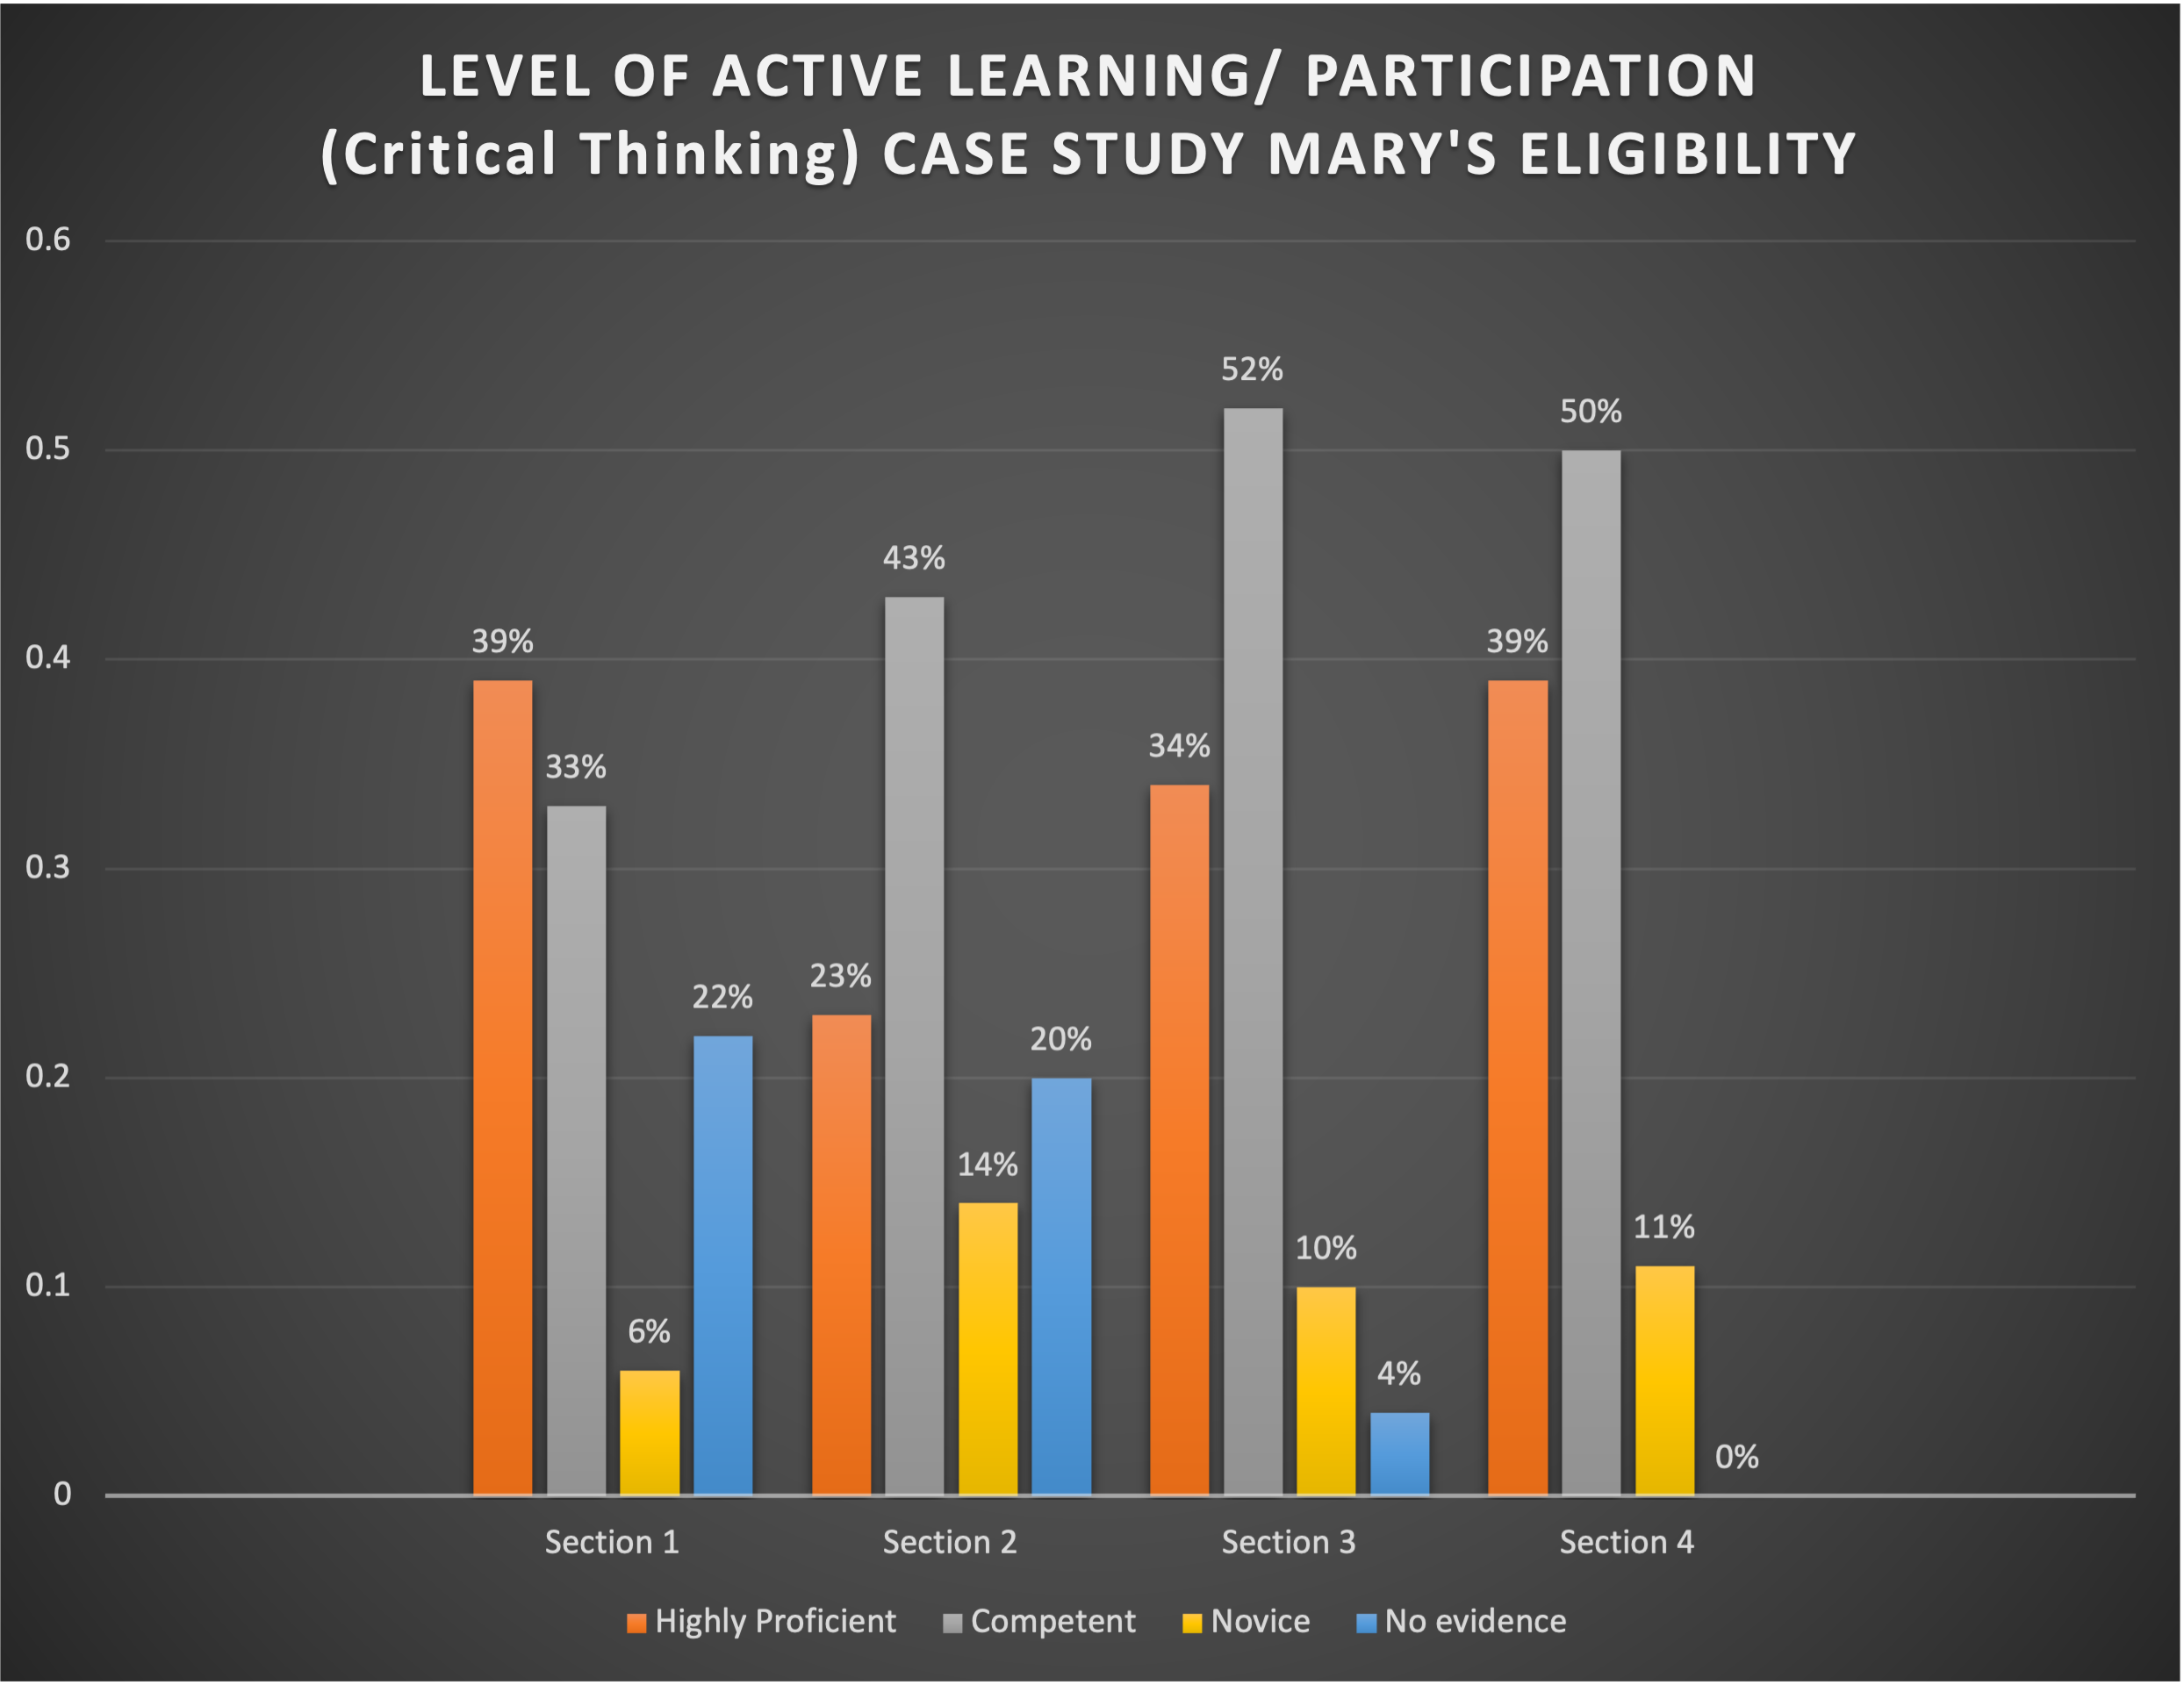
Bar graph titled 'LEVEL OF ACTIVE LEARNING/PARTICIPATION (Critical Thinking) CASE STUDY MARY'S ELIGIBILITY'.The graph shows four sets of bars across four sections, representing levels of proficiency: 'Highly Proficient', 'Competent', 'Novice', and 'No evidence'. For Section 1: 'Highly Proficient' is at 39%, 'Competent' at 33%, 'Novice' at 6%, and 'No evidence' at 22%. For Section 2: 'Highly Proficient' is at 23%, 'Competent' at 43%, 'Novice' at 14%, and 'No evidence' at 20%. For Section 3: 'Highly Proficient' is at 34%, 'Competent' at 52%, 'Novice' at 10%, and 'No evidence' at 4%. For Section 4: 'Highly Proficient' is at 39%, 'Competent' at 50%, 'Novice' at 11%, and 'No evidence' at 0%. The bars are colored orange, gray, yellow, and blue respectively, against a dark background.